
 |
 |
 |
 |
 |
 |
 |
 |
 |
 |
 |
 |
 |
| Click on Systematics for a printable version of this article. |
Systematics: Naming Organisms and Reconstructing the Evolutionary History of Life |
In
the last paragraph of The
Origin of Species Charles Darwin
 (1809-1882)
reflects eloquently on the common ancestry of life
on Earth. (1809-1882)
reflects eloquently on the common ancestry of life
on Earth.
“There
is a grandeur in this view of life, with its several powers,
having been originally breathed by the Creator
into a few forms or into one; and that whilst this planet
has gone cycling on according to the fixed law of gravity,
from
so simple a beginning endless forms most beautiful and most
wonderful have been, and are being created (Darwin, 1859/1993,
pp 648-649).” Click on picture to the right. In adult humans each
of the more than ten trillion cells can be traced back to
the original unicellular
zygote. The zygote itself was the product of a sperm fertilizing
an
egg cell. The sperm and egg cell can be traced back to the
zygotes from which they arose. This simple thought experiment
takes us back from one generation to the next. There exists
an unbroken continuity to life; we can trace all of our cells
back to the very first cells that existed on Earth. Thus,
we can infer from the Cell Doctrine that all organisms can
trace
their cells back to the very first cell from which all life
arose some 3.5 billion years ago (deDuve, 2002, pp 9-10). In science, taxonomy
is the formal classification of organisms. Today, taxonomic
systems strive to cluster organisms into natural
hierarchical groupings based upon morphology and phylogeny.
Organisms are classified using a system developed by the Swedish
scientist Carolous Linnaeus (1707-1778). Prior to Linnaeus
the names of organisms consisted of descriptive phrases.
These
phrases were called polynomials. Linnaeus was attempting to
classify life on Earth in his book Systema Naturae,
first published in 1735. Linnaeus used polynomials, but also
provided a condensed
two-word Latin name for each organism. This two-word system
is called binomial nomenclature and is still used today. In 1942 the famous evolutionary
biologist,
Ernst Mayr (1904-2005), proposed the biological species concept.
A biological species is a group of actually or potentially
interbreeding natural populations that are reproductively
isolated from other such groups. Identifying a species can
be problematic. Breeding
habits are not always known and less than 20% of living species
are properly described.
Many living species are described using morphology. Fossil
species are defined using morphology and phylogeny. Classification is always changing as new fossil and molecular data are gathered. The desire to form groups based upon evolutionary relationships has led to the development of several contrasting taxonomic schools over the years. Evolutionary taxonomy, numerical taxonomy, and cladism were all developed in an attempt to uncover evolutionary relationships. All of these systems go beyond traditional taxonomy in that they strive to understand the diversity of organisms and the relationships among them. The science that studies biodiversity is called systematics. Systematics combines traditional taxonomy, phylogeny, and biogeography to understand the evolutionary history of life on Earth. Of the three competing systems mentioned above we will focus on cladism as it has become the standard for working scientists. For a discussion of all three systems see Bringing Fossils to Life by Donald Prothero. Cladistics & The Tree of LifeMultiple
lines of evidence, including morphological data, biochemistry,
and
DNA sequencing support that all organisms are genetically
related. A single branching tree of life or phylogeny connects
all living and extinct forms of life. Evolutionary relationships
between organisms are established through cladistic analysis
of morphological data and molecular phylogeny reconstruction. |
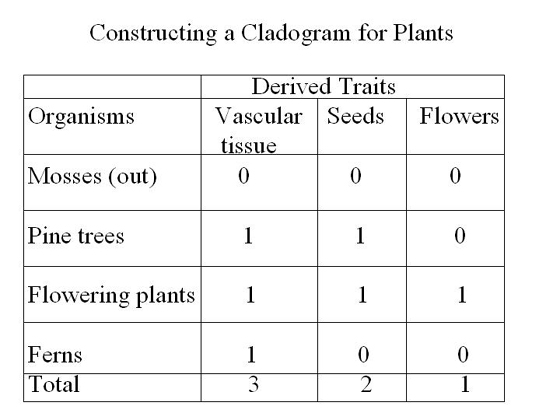 |
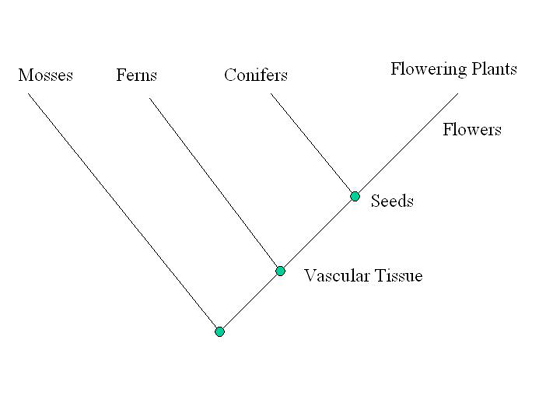
| Starting with a diagonal line, the out-group is placed on the first branch. Just past the first branch, the most common derived trait is listed; in this case vascular tissue is composed of tube-like cells. The branching point or node on a cladogram marks the point where shared derived characters arose. Next, the second most common derived trait is determined, which in this case is seeds. Ferns lack seeds and are thus placed on the second branch. The third most common derived trait is flowers. Conifers do not have flowers and are thus placed on the third branch. Flowering plants are placed at the end. |
 |
| Monophyletic
Groups Cladograms show the closeness of relationships or how recently two groups shared a common ancestor. The distances between nodes are relative not absolute, so a cladogram is not an evolutionary tree. The cladogram, supported by unique shared derived characters, shows only that two taxa, branching from a common node, are closely related sister groups. A sister group consists of two lineages sharing a common ancestor from which no other lineages have sprung. Three kinds of cladistic groupings are recognized. A monophyletic group or clade arise from a single ancestor and include all the living and fossil descendants of that ancestor (Benton, 2005, p. 32). Many familiar groups are monophyletic such as the phylum Chordata or subphylum Vertebrata. The members of a clade or monophyletic group share at least one derived character. A goal of cladistic analysis is to identify monophyletic groups because they are natural groups, true to phylogeny. Many traditional classifications include non-monophyletic groupings, although they are avoided whenever possible. A paraphyletic group is a taxon that includes some but not all of the descendants of a common ancestor (Prothero, 1998, p. 422). In a paraphyletic group some of the descendents have lost the derived trait. The class Reptilia is a well-known paraphyletic group. Reptiles most likely arose from a common ancestor, but the group excludes birds (class Aves), which are descended from reptiles. The term evolutionary grade is sometimes used to denote a paraphyletic group. The class Reptilia has been replaced by the class Sauropsida, which is monophyletic because it includes birds. A
polyphyletic group is a taxon that includes groups from
two unrelated
lineages (Prothero, 1998, p. 423). In a polyphyletic
group the apparent derived character
is actually the result of
convergent
evolution
and
the common
shared
ancestor
does not possess the feature. Grouping elephants, hippos,
and rhinos into pachyderms is an example of a polyphyletic
grouping (Benton,
2005, pp 31-32). Combining mammals and birds based upon
the characteristic of being warm-blooded represents a polyphyletic
grouping. Multiple
methods are used to compare the distances between sequenced
nucleic
acids
(DNA and
RNA)
or proteins.
A molecular
tree of relationships is produced from the aligned gene
or protein sequences. The idea that molecules may mutate
at
a predictable
rate has led to the concept of the molecular clock. Thus
differences in molecular structure can be turned into
time of divergence
(Benton, 2005, pp 34-35). Molecular phylogeny reconstructions
represent
an independent approach
to
discovering phylogeny because they use genetic comparisons
instead of morphological differences as in cladistic
analyses. Molecular
data support a growing body of evidence for the importance
of horizontal or lateral
gene transfer. Horizontal gene transfer or HGT is known to
be important
in the evolution of prokaryotes (Bacteria & Archaea). HGT
may also be a significant evolutionary factor for unicellular
eurkaryotes. So, the vertical gene transfer supposed by a tree
of life analogy is not the whole story. Some scientists argue
that an evolutionary web or net reticulating from the three
domains
of Bacteria,
Archaea,
and
Eukayota would
be a more useful analogy for the evolution of life than
a tree. Dr. W. Ford Doolittle points out that while some evolutionary
relationships are tree-like, many others are not (Lawton, 2009,
p. 39). |
Bibliography |
Benton, M.J. (2005) Vertebrate Palaeontology [3rd Edition]. Blackwell Publishing: Main, USA. Berra, T.M. (2009). Charles
Darwin: The Concise Story of an Extraordinary Man. Baltimore: The John Hopkins University Press. De Duve, C. (2002). Life
Evolving: Molecules, Mind, and Meaning.
New York: Oxford University Press. Lawton,
G. (2009). Why Darwin was wrong about the tree of life.
New Scientist, January, 2009,
34-39. |